Vico 2.1.0 (in alpha) adds Compose Multiplatform support. Switch guide versions.
8.1. Starter examples
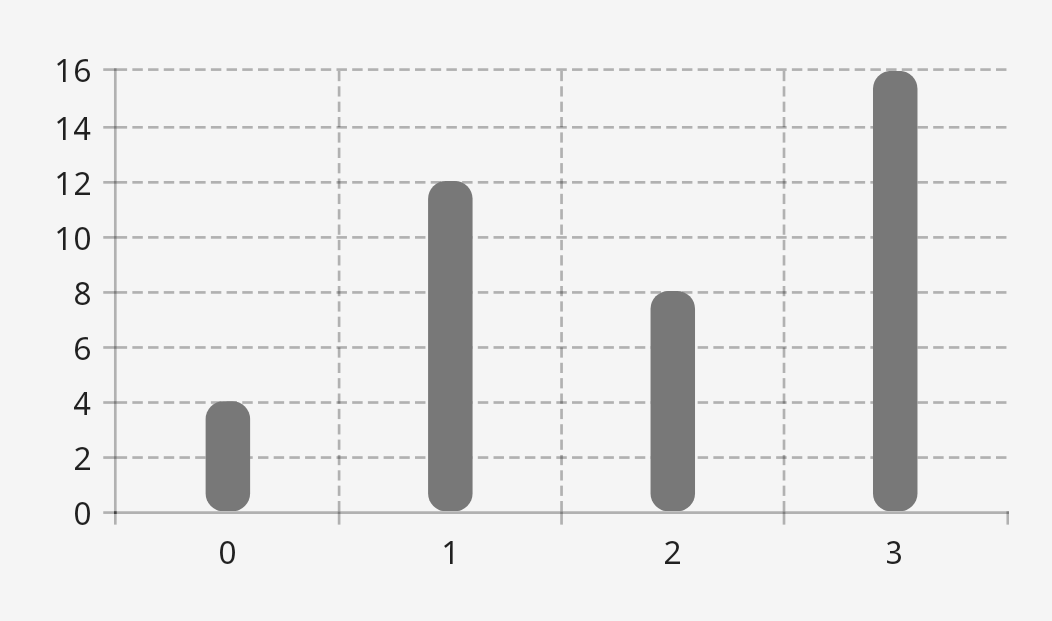
8.1.1. Column chart
The following has been adapted from the “Basic column chart” sample chart.
<style name="ChartStyle">
    <item name="layers">column</item>
    <item name="showBottomAxis">true</item>
    <item name="showStartAxis">true</item>
</style><com.patrykandpatrick.vico.views.cartesian.CartesianChartView
android:id="@+id/chart_view"
android:layout_width="match_parent"
android:layout_height="wrap_content"
app:chartStyle="@style/ChartStyle" />At the top level of the Activity:
val modelProducer = CartesianChartModelProducer()In onCreate:
chartView.modelProducer = modelProducer
lifecycleScope.launch {
    modelProducer.runTransaction {
        columnSeries { series(5, 6, 5, 2, 11, 8, 5, 2, 15, 11, 8, 13, 12, 10, 2, 7) }
    }
}
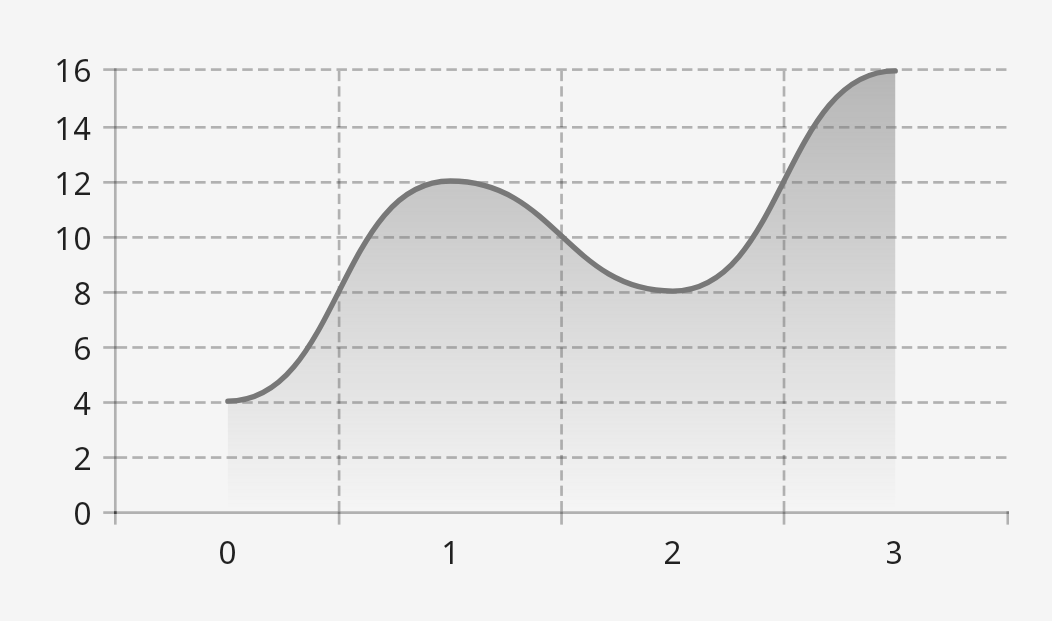
8.1.2. Line chart
The following has been adapted from the “Basic line chart” sample chart.
<style name="ChartStyle">
    <item name="layers">line</item>
    <item name="showBottomAxis">true</item>
    <item name="showStartAxis">true</item>
</style><com.patrykandpatrick.vico.views.cartesian.CartesianChartView
android:id="@+id/chart_view"
android:layout_width="match_parent"
android:layout_height="wrap_content"
app:chartStyle="@style/ChartStyle" />At the top level of the Activity:
val modelProducer = CartesianChartModelProducer()In onCreate:
chartView.modelProducer = modelProducer
lifecycleScope.launch {
    modelProducer.runTransaction {
        lineSeries { series(13, 8, 7, 12, 0, 1, 15, 14, 0, 11, 6, 12, 0, 11, 12, 11) }
    }
}
8.1.3. More
For more examples, refer to the sample app.