Charts
Vico includes three default chart types. These extend BaseChart, which in turn implements Chart. You can use either of these two to create entirely custom chart types. In Jetpack Compose, to set the type of a chart, use the chart parameter of the Chart composable. In the view system, use the XML attributes or the chart field of BaseChartView.
Across this wiki, in the context of the view system, we’ll be mentioning fields and functions of the Chart interface, so keep in mind that an instance of an implementation of this interface is accessible via the chart field of BaseChartView.
Notably, all Chart implementations have an axisValuesOverrider field, enabling you to customize the values displayed along a chart’s axes, which are controlled by the host. columnChart and lineChart, described below, have parameters with the same name.
ColumnChart
ColumnChart displays data as vertical bars. Each of these bars is a LineComponent, enabling you to customize the bars’ colors, strokes, and other properties. Data labels are supported. For ChartEntryModels comprising multiple series, a ColumnChart’s columns can be either grouped or stacked. For Jetpack Compose, a columnChart function is available.

In Jetpack Compose, customize a ColumnChart’s columns as shown below. In the view system, use the XML attributes or ColumnChart#columns. Note that some customization options are at the ColumnChart level, not at the LineComponent level.
columnChart(
    listOf(lineComponent(...), ...),
    ...
)
LineChart
LineChart displays data as continuous lines. Each line corresponds to a LineSpec instance. You can customize the lines’ colors and widths, add points and data labels, and more. PointConnector, the default implementation of which is DefaultPointConnector, allows you to customize a line’s shape. Importantly, LineChart supports entries whose x values aren’t multiples of the x step. (To utilize this functionality, first lock the x step via the host.) For Jetpack Compose, a lineChart function is available.

In Jetpack Compose, customize a LineChart’s lines as shown below. In the view system, use the XML attributes or LineChart#lines. Note that some customization options are at the LineChart level, not at the LineSpec level.
lineChart(
    remember { listOf(lineSpec(...), ...) },
    ...
)
ComposedChart
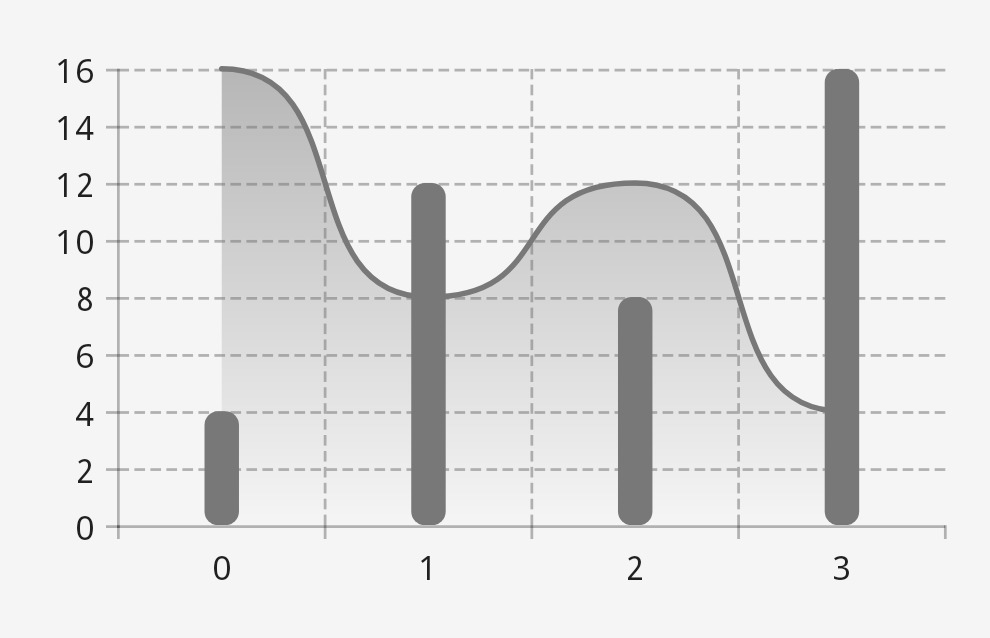
ComposedChart combines multiple Charts into one, displaying them on top of one another. If you’d like them to be independently scaled, you can specify to which vertical axis each one should be linked—use the targetVerticalAxisPosition field of ColumnChart and the targetVerticalAxisPosition field of LineChart, or the targetVerticalAxisPosition parameters of columnChart and lineChart. A plus function is available for combining two Charts into a ComposedChart.
In Jetpack Compose, use remember to ensure that your ComposedChart isn’t recreated on every composition:
val columnChart = columnChart()
val lineChart = lineChart()
val composedChart = remember(columnChart, lineChart) { columnChart + lineChart }
