Basic examples
Here we provide some basic examples to give you an idea of how Vico works.
Static chart
Chart data is stored in ChartEntryModels. For a simple static chart, you can create an instance of this class via entryModelOf, which accepts consecutive y values.
val chartEntryModel = entryModelOf(4f, 12f, 8f, 16f)
To display a chart in Jetpack Compose, use the Chart composable function. Here we’re using lineChart to create a line chart, and we’re adding two axes.
Chart(
    chart = lineChart(),
    model = chartEntryModel,
    startAxis = rememberStartAxis(),
    bottomAxis = rememberBottomAxis(),
)
To create the same chart in the view system, use ChartView.
<com.patrykandpatrick.vico.views.chart.ChartView
    android:id="@+id/chart_view"
    android:layout_width="wrap_content"
    android:layout_height="wrap_content"
    app:chart="line"
    app:showStartAxis="true"
    app:showBottomAxis="true" />
findViewById<ChartView>(R.id.chart_view).setModel(chartEntryModel)

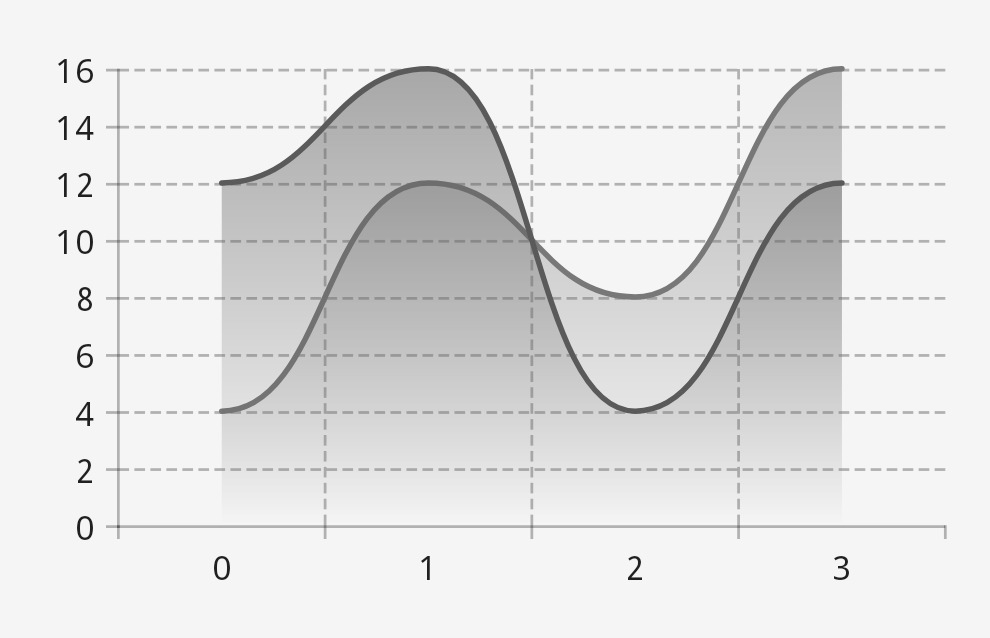
We can display two lines by updating the ChartEntryModel to contain two series.
val chartEntryModel = entryModelOf(entriesOf(4f, 12f, 8f, 16f), entriesOf(12f, 16f, 4f, 12f))

Dynamic chart
Here’s a simple function that creates a list of four FloatEntry instances with random y values.
fun getRandomEntries() = List(4) { entryOf(it, Random.nextFloat() * 16f) }
A list returned by this function can be used to create a ChartEntryModelProducer. The best place to do this is a ViewModel class.
val chartEntryModelProducer = ChartEntryModelProducer(getRandomEntries())
In Jetpack compose, use the Chart composable function once again, but this time the variant with a chartModelProducer parameter. Let’s create a column chart.
Chart(
    chart = columnChart(),
    chartModelProducer = chartEntryModelProducer,
    startAxis = rememberStartAxis(),
    bottomAxis = rememberBottomAxis(),
)
For the view system, use the following.
<com.patrykandpatrick.vico.views.chart.ChartView
    android:id="@+id/chart_view"
    android:layout_width="wrap_content"
    android:layout_height="wrap_content"
    app:chart="column"
    app:showStartAxis="true"
    app:showBottomAxis="true" />
findViewById<ChartView>(R.id.chart_view).entryProducer = chartEntryModelProducer
With a ChartEntryModelProducer, you can easily update your chart’s data.
chartEntryModelProducer.setEntries(getRandomEntries())

Composed chart
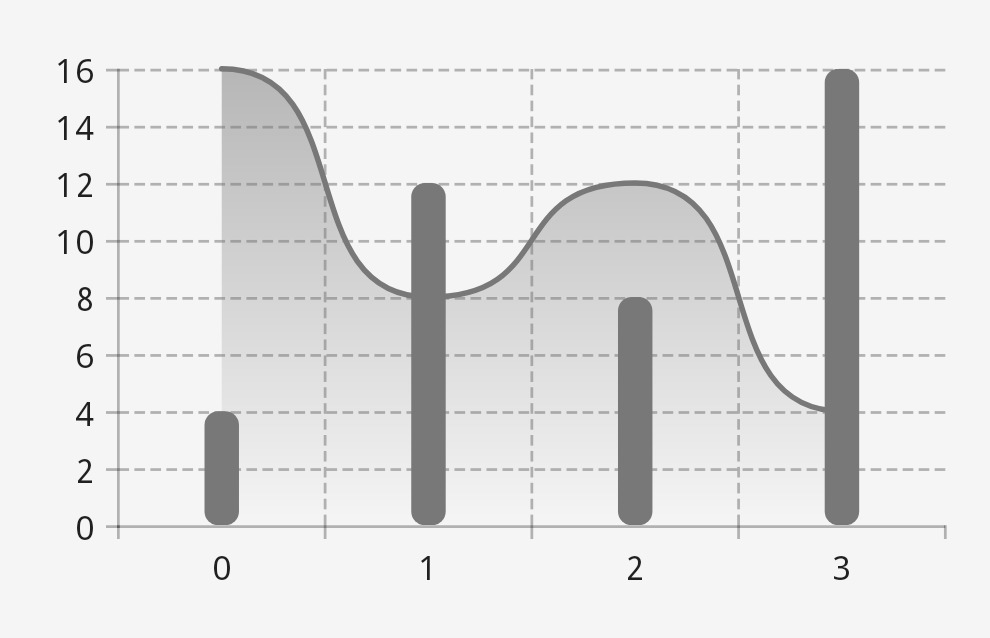
Composed charts combine multiple charts into one. A composed chart requires a ComposedChartEntryModel. Here, we’ll use a ComposedChartEntryModelProducer instance.
val composedChartEntryModelProducer = ComposedChartEntryModelProducer.build {
    add(entriesOf(4f, 12f, 8f, 16f))
    add(entriesOf(16f, 8f, 12f, 4f))
}
We can now create our composed chart in Jetpack Compose.
val columnChart = columnChart()
val lineChart = lineChart()
Chart(
    chart = remember(columnChart, lineChart) { columnChart + lineChart },
    chartModelProducer = composedChartEntryModelProducer,
    startAxis = rememberStartAxis(),
    bottomAxis = rememberBottomAxis(),
)
And here’s the same chart in the view system. We’re now using ComposedChartView.
<com.patrykandpatrick.vico.views.chart.ComposedChartView
    android:id="@+id/composed_chart_view"
    android:layout_width="wrap_content"
    android:layout_height="wrap_content"
    app:charts="column|line"
    app:showStartAxis="true"
    app:showBottomAxis="true" />
findViewById<ComposedChartView>(R.id.composed_chart_view).entryProducer = composedChartEntryModelProducer
