Axes
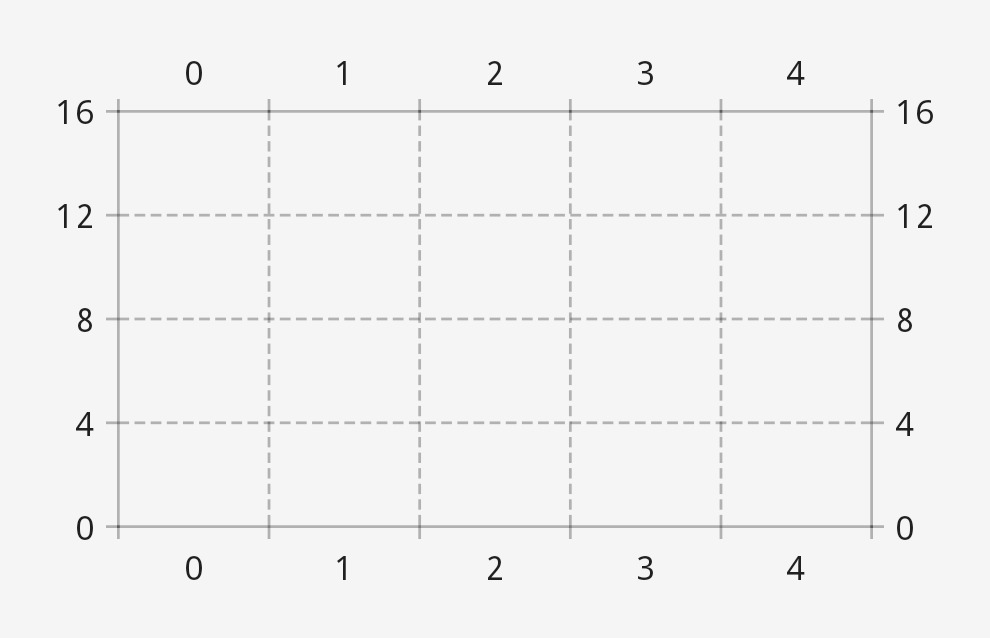
You can display an axis along each of the four edges of a CartesianChart. There are two axes: HorizontalAxis and VerticalAxis. Numerous customization options are available—you can change the appearance of the labels, modify the axis lines, add titles, and more.
The itemPlacer parameters and properties let you apply HorizontalAxis.ItemPlacer and VerticalAxis.ItemPlacer instances, enabling you to customize for what x and y values labels and lines are displayed. Four factory functions are available:
HorizontalAxis.ItemPlacer.aligned(default)HorizontalAxis.ItemPlacer.segmentedVerticalAxis.ItemPlacer.step(default)VerticalAxis.ItemPlacer.count
Custom implementations can be created.
For information on x and y range customization, see the “CartesianLayerRangeProvider” section of the CartesianLayer introduction page.
- Compose
- Views
Use the VerticalAxis.rememberStart, HorizontalAxis.rememberTop, VerticalAxis.rememberEnd, and HorizontalAxis.rememberBottom functions to create axes:
CartesianChartHost(
    chart = rememberCartesianChart(
        startAxis = VerticalAxis.rememberStart(...),
        topAxis = HorizontalAxis.rememberTop(...),
        endAxis = VerticalAxis.rememberEnd(...),
        bottomAxis = HorizontalAxis.rememberBottom(...),
        ...
    ),
    ...
)
For the label, axis, tick, and guideline parameters of these functions, you can use rememberAxisLabelComponent, rememberAxisLineComponent, rememberAxisTickComponent, and rememberAxisGuidelineComponent, which have more suitable defaults than rememberTextComponent and rememberLineComponent.
Use the XML attributes to create axes:
<com.patrykandpatrick.vico.views.cartesian.CartesianChartView
    android:id="@+id/chart_view"
    app:showStartAxis="true"
    app:showTopAxis="true"
    app:showEndAxis="true"
    app:showBottomAxis="true"
    ... />
Alternatively, use HorizontalAxis.build and VerticalAxis.build:
cartesianChartView.chart.startAxis = VerticalAxis.start(...)
cartesianChartView.chart.topAxis = HorizontalAxis.top(...)
cartesianChartView.chart.endAxis = VerticalAxis.end(...)
cartesianChartView.chart.bottomAxis = HorizontalAxis.bottom(...)