Value formatting
x and y values are numerical. You can use CartesianValueFormatter to format them for display. They can remain numbers, or they can be transformed to dates, category names, and so on.
There are two CartesianValueFormatter factory functions: CartesianValueFormatter.decimal and CartesianValueFormatter.yPercent. For more complex use cases, create custom implementations can be created. CartesianValueFormatters are most commonly used with HorizontalAxis and VerticalAxis—see the valueFormatter parameters and properties. However, these aren’t the only APIs that accept CartesianValueFormatter instances.
When the values remain numerical, formatting is straightforward. DecimalFormat, which is used by CartesianValueFormatter.decimal, is typically involved. Thus, on this page, we focus on formatting with nonnumerical results. The aim in such cases is to find a predictable mapping that doesn’t involve overly large values (as these can lead to precision loss). The optimal approach depends on the use case. Some common situations are discussed below.
Categories
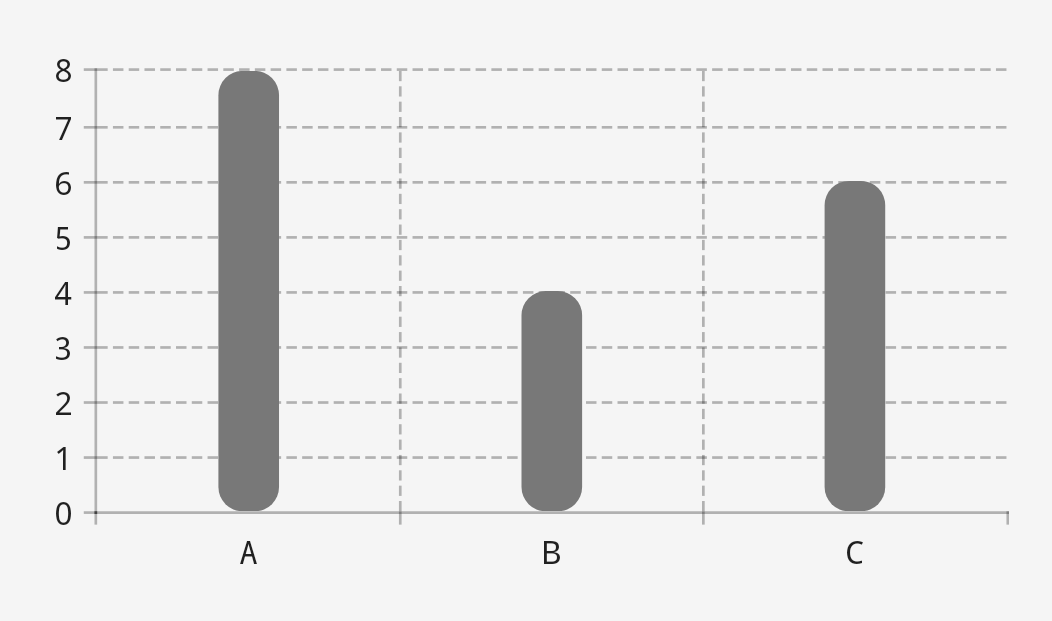
A chart’s domain can be a list of categories. An easy way to implement this pattern is to use x values that serve as indices. As discussed on the previous pages, the series-creating functions have overloads that add such x values automatically.
val data = mapOf("A" to 8f, "B" to 4f, "C" to 6f)
val labelListKey = ExtraStore.Key<List<String>>()
cartesianChartModelProducer.runTransaction {
    columnSeries { series(data.values) }
    updateExtras { it[labelListKey] = data.keys.toList() }
}
CartesianValueFormatter { context, x, _ -> context.model.extraStore[labelListKey][x.toInt()] }
Dates
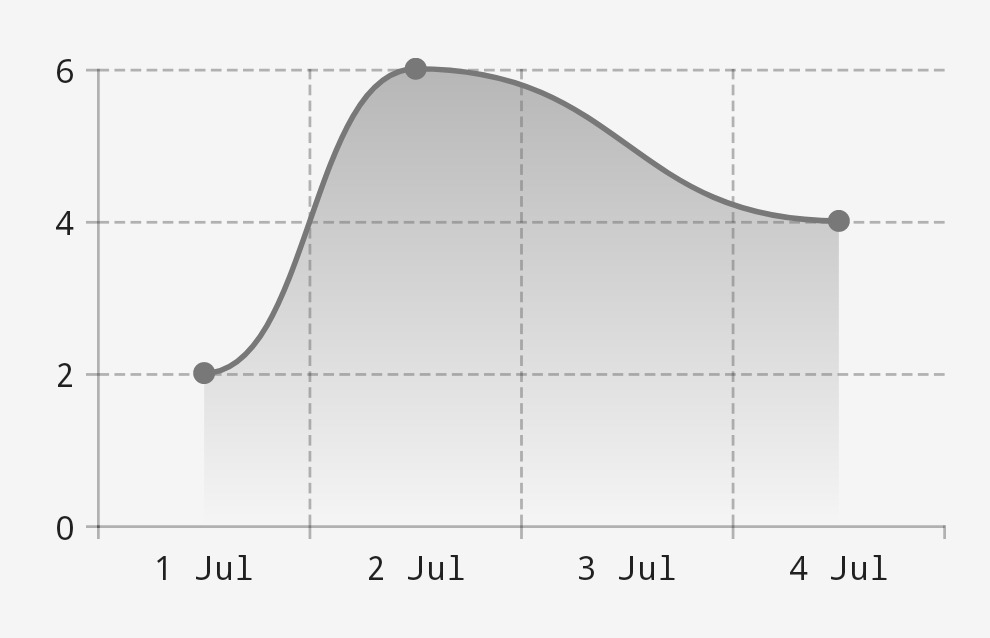
Another common use case is mapping dates to y values.
The dates will be spaced out proportionally. If you need nonproportional spacing, use the approach described under “Categories.” This is also worth considering if there are no gaps in your data, in which case there’s no distinction between proportional and nonproportional spacing—the category approach will be simpler.
Different solutions are required depending on the date precision and range. For days, a straightforward mapping can be used:
val data =
    mapOf(
        LocalDate.parse("2022-07-01") to 2f,
        LocalDate.parse("2022-07-02") to 6f,
        LocalDate.parse("2022-07-04") to 4f,
    )
val xToDateMapKey = ExtraStore.Key<Map<Float, LocalDate>>()
val xToDates = data.keys.associateBy { it.toEpochDay().toFloat() }
cartesianChartModelProducer.runTransaction {
    lineSeries { series(xToDates.keys, data.values) }
    updateExtras { it[xToDateMapKey] = xToDates }
}
val dateTimeFormatter = DateTimeFormatter.ofPattern("d MMM")
CartesianValueFormatter { context, x, _ ->
    (context.model.extraStore[xToDateMapKey][x] ?: LocalDate.ofEpochDay(x.toLong()))
        .format(dateTimeFormatter)
}
However, if greater precision is required, the data must be further transformed. If the desired precision level is one second, for example, then using raw second timestamps will produce overly large x values. In such cases, transformations like these can be used:
- Subtract the smallest timestamp from all timestamps, save it as an extra, and add it back during formatting. The first x value will be zero.
- Ensure that the minimum time delta that needs to be represented corresponds to an x delta of one. For instance, if the minimum time delta is ten seconds, then two y values that are ten seconds apart should be linked to x values that differ by one, not by ten. Undo the transformation during formatting.
The first transformation is typically sufficient.
Before applying any transformations, double-check that you’ve correctly identified the required precision level. In particular, use millisecond timestamps only if precision down to the millisecond is required, which is rarely the case. Screens have a finite number of pixels, and it’s redundant to introduce a precision level that exceeds what the screen will, realistically, be able to represent.