Line layer
LineCartesianLayers display data as lines, each of which is associated with a LineCartesianLayer.Line. The LineCartesianLayer.Lines are provided by a LineCartesianLayer.LineProvider. A base implementation of this interface can be instantiated via LineCartesianLayer.LineProvider.series. You can customize the lines’ fills, backgrounds, shapes, and other properties. You can also add data labels and points.
Line fills are customized via LineCartesianLayer.LineFill, which has two factory functions:
Area fills, which are optional, are customized via LineCartesianLayer.AreaFill. This has similar factory functions to LineCartesianLayer.LineFill:
These cover most use cases. You can use both solid colors and DynamicShaders, and you can apply split styling—enabling you to create a line that’s green for positive values and red for negative values, for instance. You can, however, also create your own LineCartesianLayer.LineFill and LineCartesianLayer.AreaFill implementations.
To add points, use LineCartesianLayer.PointProvider. LineCartesianLayer.PointProvider.single instantiates a base implementation that adds a point for each entry and uses a shared point style. Once again, custom implementations can be created. A common use case for this is styling points individually based on their y values.
- Compose
- Views
To create a LineCartesianLayer, use the rememberLineCartesianLayer composable function:
CartesianChartHost(chart = rememberCartesianChart(rememberLineCartesianLayer(...), ...), ...)
Create LineCartesianLayer.Lines via LineCartesianLayer.rememberLine.
To create a LineCartesianLayer, use the XML attributes:
<com.patrykandpatrick.vico.views.cartesian.CartesianChartView
    android:id="@+id/chart_view"
    app:layers="line"
    ... />
Alternatively, use the LineCartesianLayer constructors:
cartesianChartView.chart = CartesianChart(LineCartesianLayer(...), ...)
Create LineCartesianLayer.Lines via the XML attributes or the constructor.
Data
LineCartesianLayers use LineCartesianLayerModels. When using a CartesianChartModelProducer, add LineCartesianLayerModels via lineSeries:
cartesianChartModelProducer.runTransaction {
    lineSeries {
        series(1, 8, 3, 7)
        series(y = listOf(6, 1, 9, 3))
        series(x = listOf(1, 2, 3, 4), y = listOf(2, 5, 3, 4))
    }
    ...
}
Each series invocation adds a series to the LineCartesianLayerModel. Above, three series are added. series has three overloads (each of which accepts all Number subtypes):
- a
varargoverload that takes y values and uses their indices as the x values - an overload that takes a
Collectionof y values and uses their indices as the x values - an overload that takes a
Collectionof x values and aCollectionof y values of the same size
When creating a CartesianChartModel directly, you can add a LineCartesianLayerModel by using build. This function gives you access to the same DSL that lineSeries does.
CartesianChartModel(
    LineCartesianLayerModel.build {
        series(1, 8, 3, 7)
        series(y = listOf(6, 1, 9, 3))
        series(x = listOf(1, 2, 3, 4), y = listOf(2, 5, 3, 4))
    },
    ...
)
Examples
Basic
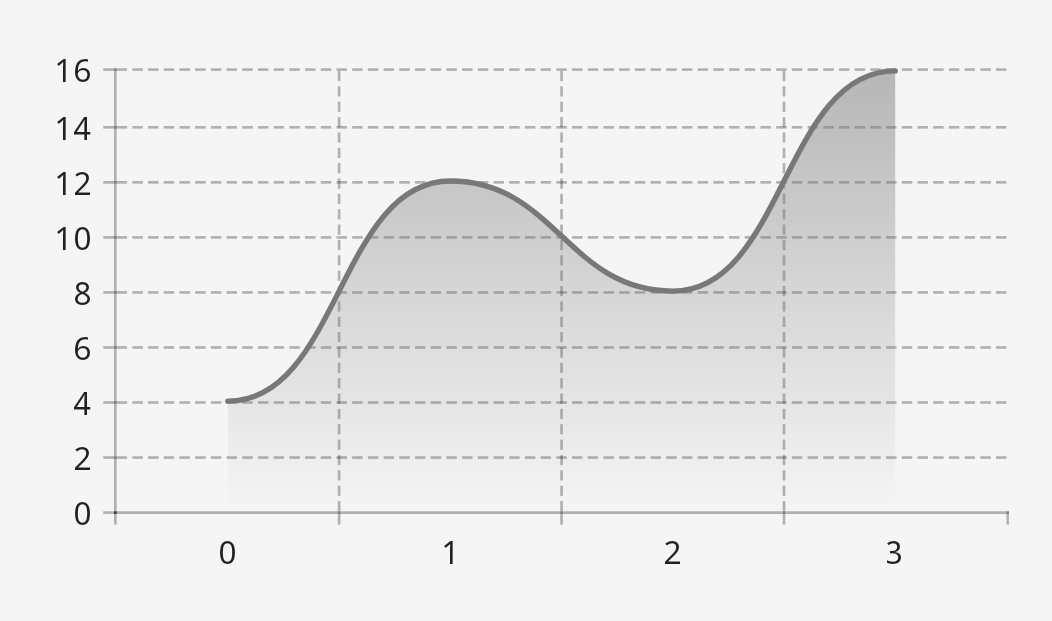
Here’s a simple, unstyled line chart:
- Compose
- Views
val modelProducer = remember { CartesianChartModelProducer() }
LaunchedEffect(Unit) { modelProducer.runTransaction { lineSeries { series(4, 12, 8, 16) } } }
CartesianChartHost(
    rememberCartesianChart(
        rememberLineCartesianLayer(),
        startAxis = rememberStartAxis(),
        bottomAxis = rememberBottomAxis(),
    ),
    modelProducer,
)
<com.patrykandpatrick.vico.views.cartesian.CartesianChartView
    android:id="@+id/chart_view"
    android:layout_width="match_parent"
    android:layout_height="wrap_content"
    app:layers="line"
    app:showBottomAxis="true"
    app:showStartAxis="true" />
At the top level of the Activity:
val modelProducer = CartesianChartModelProducer()
In onCreate:
chartView.modelProducer = modelProducer
lifecycleScope.launch { modelProducer.runTransaction { lineSeries { series(4, 12, 8, 16) } } }