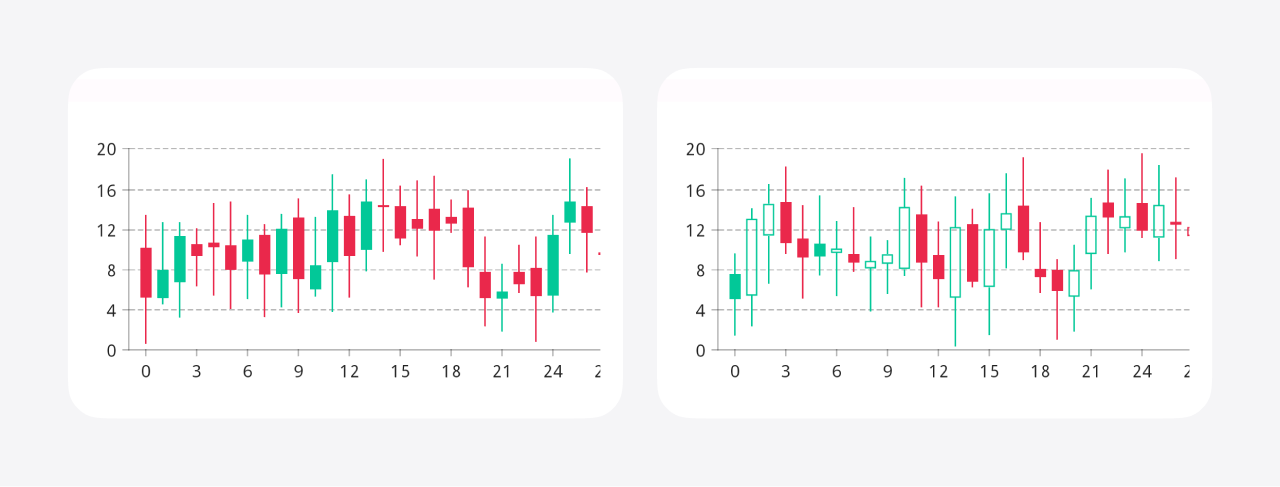
Candlestick layer

Use CandlestickCartesianLayer to create candlestick charts. Each candle’s style is defined by its corresponding Candle. The Candles are provided by a CandlestickCartesianLayer.CandleProvider.
- Compose
- Views
- To style candles based on their absolute price changes (closing vs. opening), use
CandlestickCartesianLayer.CandleProvider.absolute. This is commonly used for filled candles. - To style candles based on both their absolute price changes (closing vs. opening) and their relative price changes (closing vs. previous closing), use
CandlestickCartesianLayer.CandleProvider.absoluteRelative. This is commonly used for hollow candles. - For custom behavior, create a
CandlestickCartesianLayer.CandleProviderimplementation.
Be careful to import the composable CandlestickCartesianLayer.CandleProvider.absolute and CandlestickCartesianLayer.CandleProvider.absoluteRelative functions from the compose module, not the regular functions with the same names from the core module.
- To style candles based on their absolute price changes (closing vs. opening), use
CandlestickCartesianLayer.CandleProvider.absolute. This is commonly used for filled candles. - To style candles based on both their absolute price changes (closing vs. opening) and their relative price changes (closing vs. previous closing), use
CandlestickCartesianLayer.CandleProvider.absoluteRelative. This is commonly used for hollow candles. - For custom behavior, create a
CandlestickCartesianLayer.CandleProviderimplementation.
Create Candles via the XML attributes or the Candle constructor.
At the CandlestickCartesianLayer level, you can set the minimum body height, change the candle spacing, and toggle wick scaling.
- Compose
- Views
To create a CandlestickCartesianLayer, use the rememberCandlestickCartesianLayer composable function:
CartesianChartHost(chart = rememberCartesianChart(rememberCandlestickCartesianLayer(...), ...), ...)
To create a CandlestickCartesianLayer, use the XML attributes:
<com.patrykandpatrick.vico.views.cartesian.CartesianChartView
    android:id="@+id/chart_view"
    app:layers="candlestick"
    ... />
Alternatively, use the CandlestickCartesianLayer constructor:
cartesianChartView.chart = CartesianChart(CandlestickCartesianLayer(...), ...)
Data
CandlestickCartesianLayers use CandlestickCartesianLayerModels. When using a CartesianChartModelProducer, add CandlestickCartesianLayerModels via candlestickSeries:
cartesianChartModelProducer.runTransaction {
    candlestickSeries(
        x = listOf(1, 2, 3, 4),
        opening = listOf(2, 4, 6, 3),
        closing = listOf(4, 5, 3, 3),
        low = listOf(1, 4, 2, 2),
        high = listOf(5, 6, 7, 4),
    )
    ...
}
candlestickSeries also has an overload with no x parameter. This overload uses the indices of the prices as the x values.
candlestickSeries(
    opening = listOf(2, 4, 6, 3),
    closing = listOf(4, 5, 3, 3),
    low = listOf(1, 4, 2, 2),
    high = listOf(5, 6, 7, 4),
)
When creating a CartesianChartModel directly, you can add a CandlestickCartesianLayerModel by using CandlestickCartesianLayerModel.build:
CartesianChartModel(
    ColumnCartesianLayerModel.build(
        x = listOf(1, 2, 3, 4),
        opening = listOf(2, 4, 6, 3),
        closing = listOf(4, 5, 3, 3),
        low = listOf(1, 4, 2, 2),
        high = listOf(5, 6, 7, 4),
    ),
    ...
)
This function also has an overload with no x parameter:
ColumnCartesianLayerModel.build(
    opening = listOf(2, 4, 6, 3),
    closing = listOf(4, 5, 3, 3),
    low = listOf(1, 4, 2, 2),
    high = listOf(5, 6, 7, 4),
)
Examples
CandlestickCartesianLayer is a recent addition. More examples are in the works.