Column layer
ColumnCartesianLayers (column charts) display data as vertical bars, each of which corresponds to a LineComponent. The LineComponents are provided by a ColumnCartesianLayer.ColumnProvider. ColumnCartesianLayer.ColumnProvider.series creates a ColumnCartesianLayer.ColumnProvider that uses one LineComponent per series. You can create your own implementation for custom behavior, including styling columns individually based on their y values.
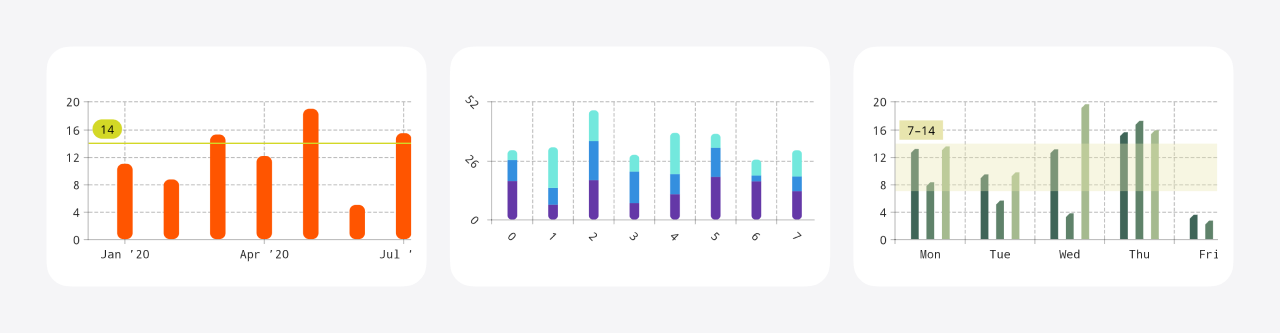
In addition to customizing the columns, at the ColumnCartesianLayer level, you can change their spacing. Data labels are supported. When multiple series are added, a ColumnCartesianLayer’s columns can be grouped horizontally or stacked.
- Compose
- Views
To create a ColumnCartesianLayer, use the rememberColumnCartesianLayer composable function:
CartesianChartHost(chart = rememberCartesianChart(rememberColumnCartesianLayer(...), ...), ...)
To create a ColumnCartesianLayer, use the XML attributes:
<com.patrykandpatrick.vico.views.cartesian.CartesianChartView
    android:id="@+id/chart_view"
    app:layers="column"
    ... />
Alternatively, use the ColumnCartesianLayer constructors:
cartesianChartView.chart = CartesianChart(ColumnCartesianLayer(...), ...)
Data
ColumnCartesianLayers use ColumnCartesianLayerModels. When using a CartesianChartModelProducer, add ColumnCartesianLayerModels via columnSeries:
cartesianChartModelProducer.runTransaction {
    columnSeries {
        series(1, 8, 3, 7)
        series(y = listOf(6, 1, 9, 3))
        series(x = listOf(1, 2, 3, 4), y = listOf(2, 5, 3, 4))
    }
    ...
}
Each series invocation adds a series to the ColumnCartesianLayerModel. Above, three series are added. series has three overloads (each of which accepts all Number subtypes):
- a
varargoverload that takes y values and uses their indices as the x values - an overload that takes a
Collectionof y values and uses their indices as the x values - an overload that takes a
Collectionof x values and aCollectionof y values of the same size
When creating a CartesianChartModel directly, you can add a ColumnCartesianLayerModel by using build. This function gives you access to the same DSL that columnSeries does.
CartesianChartModel(
    ColumnCartesianLayerModel.build {
        series(1, 8, 3, 7)
        series(y = listOf(6, 1, 9, 3))
        series(x = listOf(1, 2, 3, 4), y = listOf(2, 5, 3, 4))
    },
    ...
)
Examples
Basic
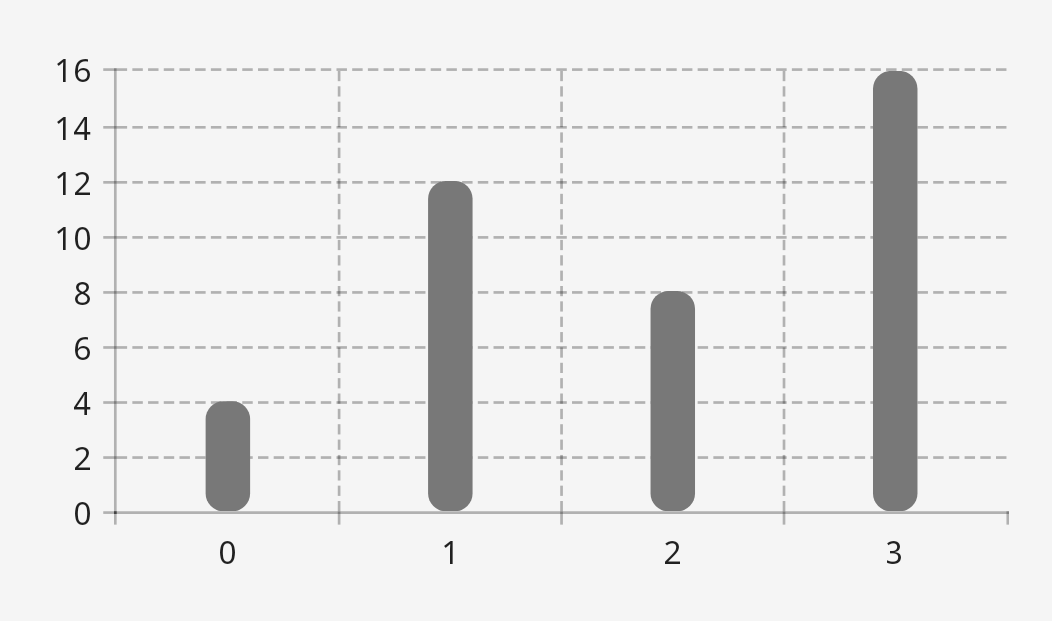
Here’s a simple, unstyled column chart:
- Compose
- Views
val modelProducer = remember { CartesianChartModelProducer() }
LaunchedEffect(Unit) { modelProducer.runTransaction { columnSeries { series(4, 12, 8, 16) } } }
CartesianChartHost(
    rememberCartesianChart(
        rememberColumnCartesianLayer(),
        startAxis = rememberStartAxis(),
        bottomAxis = rememberBottomAxis(),
    ),
    modelProducer,
)
<com.patrykandpatrick.vico.views.cartesian.CartesianChartView
    android:id="@+id/chart_view"
    android:layout_width="match_parent"
    android:layout_height="wrap_content"
    app:layers="column"
    app:showBottomAxis="true"
    app:showStartAxis="true" />
At the top level of the Activity:
val modelProducer = CartesianChartModelProducer()
In onCreate:
chartView.modelProducer = modelProducer
lifecycleScope.launch { modelProducer.runTransaction { columnSeries { series(4, 12, 8, 16) } } }